Architecture and Events
This document describes the software architecture of the ride hailing simulation, the configuration possibilities, and how you can integrate your optimization idea.
Architecture
Integration View
The following depiction shows the deployment view of the Simulation Framwork.
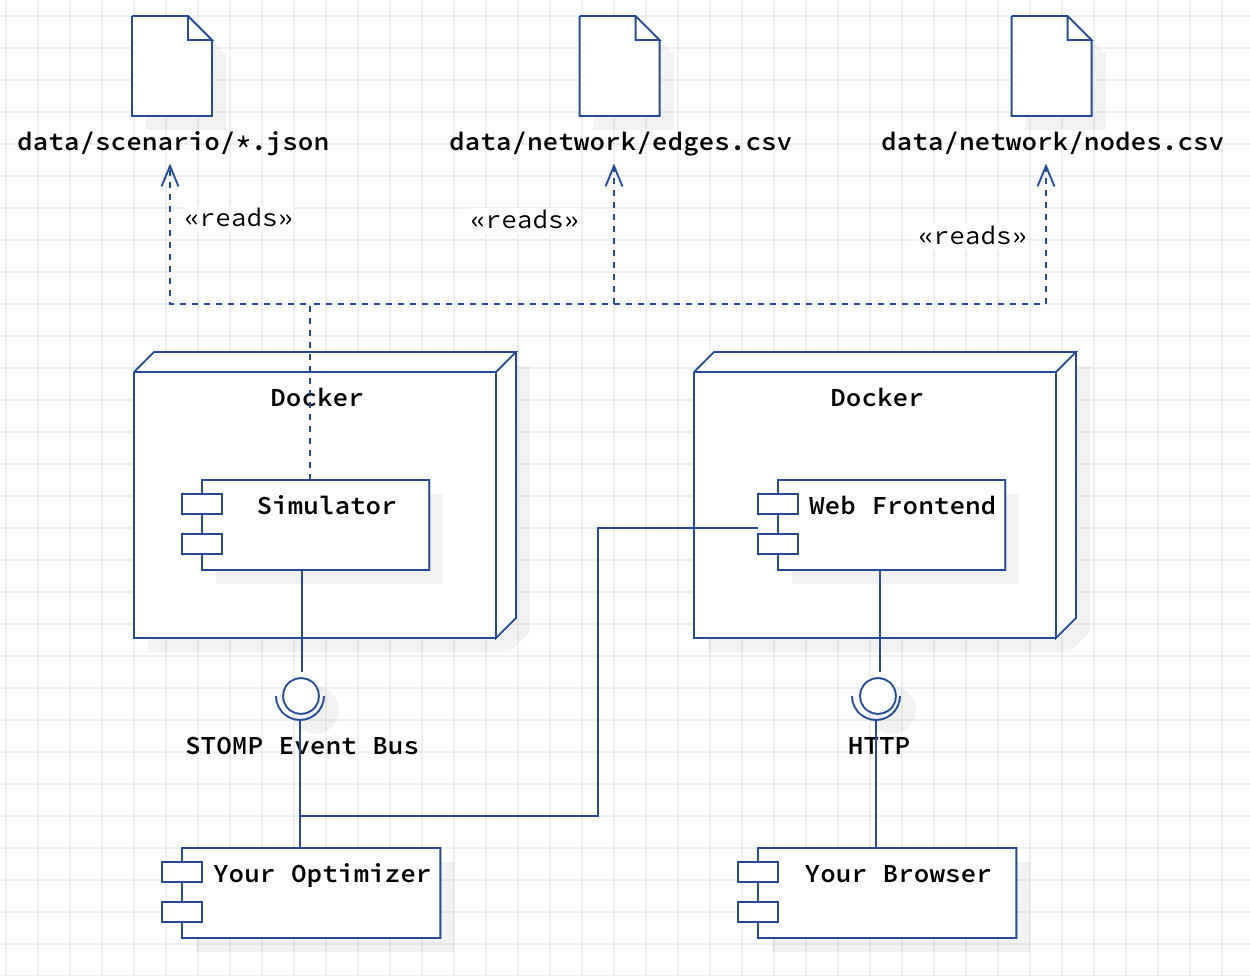
The Simulation Framework consists of two Docker containers. The first one contains the actual
Simulator. It reads several configuration files that describe the actual simulation plan. The
second container contains the Web Frontend you can open with your browser. It serves as a
graphical visualization of the simulation and gives you insights into current vehicles in the fleet,
travel requests, and metrics. The Web Frontend uses the STOMP Event Bus
to exchange information with the Simulator. This interface is also the connection to your Optimizer.
Configuration Files
The framework uses three input files that steer the actual simulation:
data/network/*.csv These files store all information on the road network that we operate on. You find detailed descriptions of the file format here.
data/scenario/*.json A series of events stored in a JSON file that describes the scenario to execute. Please click here for a detailed description of the events.
External Interfaces
HTTP You can connect to the simulation framework using a standard web browser. The web browser will show a simulation UI that displays the current map, the location of the fleet, existing requests, and additional metrics.
STOMP The STOMP-API allows your Optimizer to communicate with the
simulation. You are getting updates on changes in the simulation state, new
requests, or any other stuff you have to know about. The
Event Documentation explains the events in greater
detail.
Road Network
The road network is modelled as a directed graph, consisting of a set of nodes and a set of directed edges.
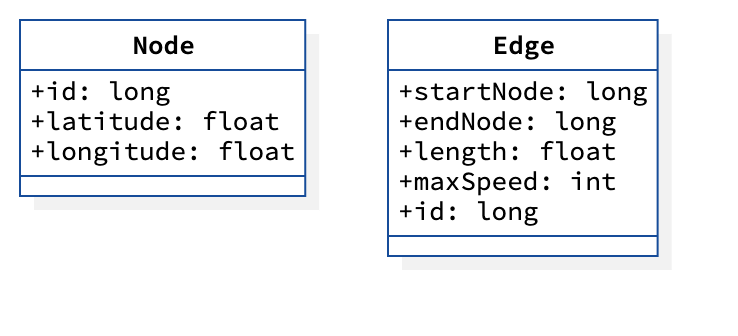
Nodes represent road intersections or segment endpoints. Directed edges represent road segments between two nodes. Two-way streets are stored as two separate directed edges.
Mapping to CSV
Node and edge data are saved in separate CSV files and modelled as follows:
Each node contains the following fields:
id(long): Unique identifier for the node.latitude(double): Latitude in WGS84 (EPSG:4326).longitude(double): Longitude in WGS84 (EPSG:4326).
Each edge contains the following fields:
id(long): Unique identifier for the edge.start-node(long): Source node ID (foreign key to nodeid).end-node(long): Target node ID (foreign key to nodeid).length(float): Length of the edge in meters.maximum-speed(int): Maximum speed (km/h) at which a vehicle can travel along this edge, assuming free-flow travel speeds.
In the CSV files, the column names contain with the corresponding data type to allow an easier parsing.
Bremen Road Network
An example road network for the city of Bremen, Germany is provided in data/networks/bremen.
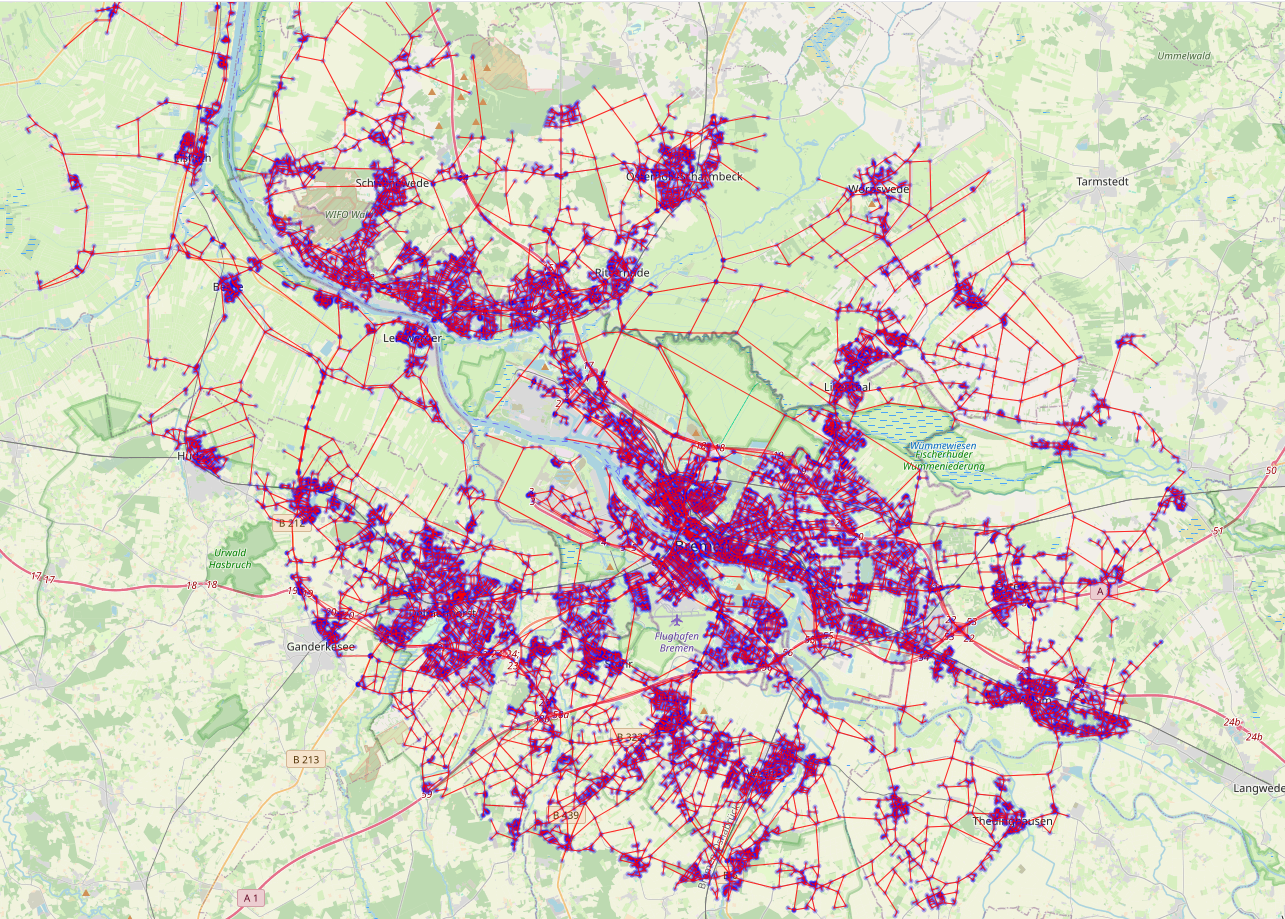
nodes.csvcontains 22.242 nodes.edges.csvcontains 52.868 directed edges.
The script used to download and save this data can be found at src/scripts/get_bremen_map_data.py.
Events
The description of the events is split into several documents, and you find them below. The events are serialized in JSON format, allowing you to write clients in any programming language. There are three sources for events: the environment, the simulation, and the optimizer. Environmental events stem from outside the simulation, such as transportation requests, traffic jams, or road closures. These events are statically generated based on a scenario or dynamically by the user interface. Simulation events are results of the actual simulation process, such as a vehicle passing an intersection (a node in the graph) or a transportation request being fulfilled. The optimizer itself sends only events regarding route planning and explanations. Other events will be filtered out by the simulation.
Note: We will often refer to events by using its short name category:name, e.g. simulation:start.